

OPPORTUNITIES & ANALYTICS
Every tender. Every stage. Every forecast.
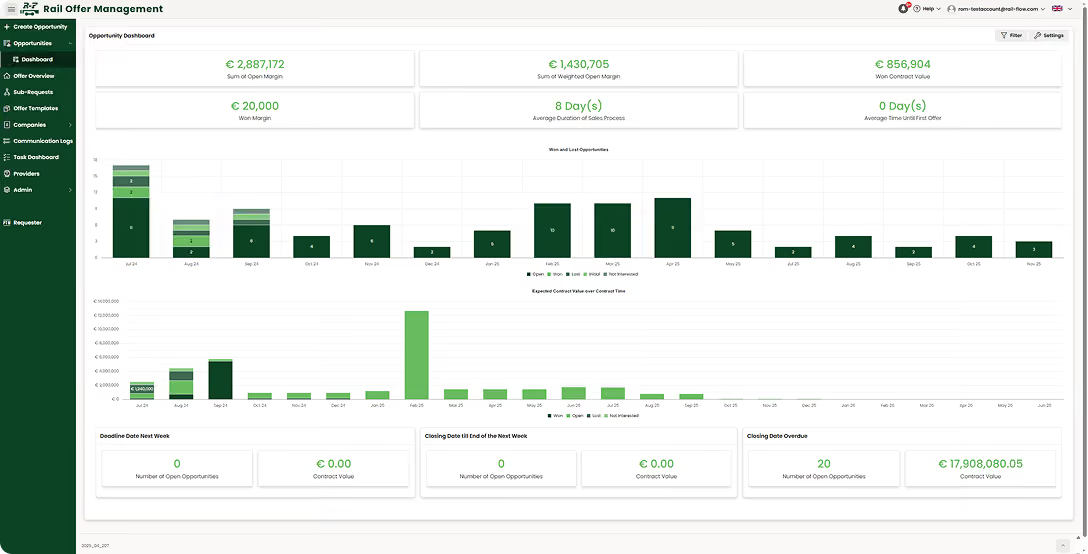
Track every opportunity stage by stage: pipeline stage, weighted revenue, tonnage and wagon forecast, contract duration, win probability, customer and lane, tender deadlines. See where revenue and capacity will land per lane before you commit, all in one place. Check other KPIs for advanced sales steering and optimised resource allocation.
KEY FEATURES
A pipeline that thinks in trains and lanes.
Stage-by-stage tracking with rail-specific fields built in; per-lane revenue and capacity forecasting; KPI dashboards for heads of sales steering the team and operations teams planning around what sales will close. Add your own fields easily if you miss a specific one.
PIPELINE
The fields rail sales actually tracks.
Every opportunity moves through your pipeline carrying the seven fields rail sales actually tracks: pipeline stage, weighted revenue, tonnage and wagon limits, contract duration, win probability, customer and lane, tender deadlines. Not a generic CRM field stack forced to fit.
The pipeline stages match your organisation, not a vendor’s default. Captured opportunities cluster into Key Accounts and Selling Centers, the way rail sales actually segments customers across regions and entities.

REPORTING
Various reporting and visualization options
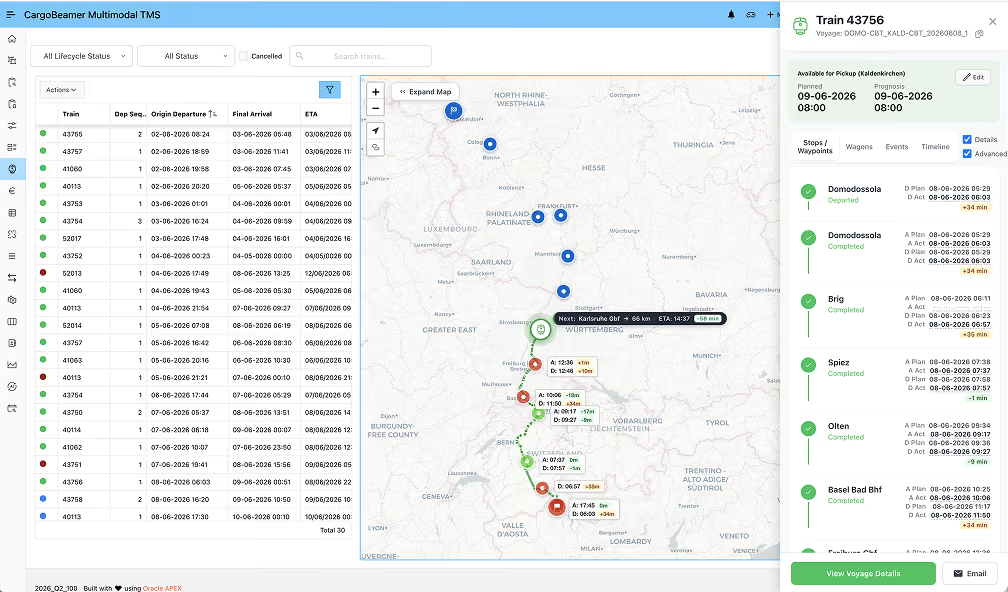
See where the revenue lands per lane, per customer, per quarter, weighted by win probability and contract duration. Visualize in a map view or subscribe to excel and csv data exports.
Complete overview of all your transports - map view, individual reports, KPI boards and graphs - don't miss any opportunity.
Map visualization
See where your business booms and where there is room for improvement.
Data subscription
Subscribe to various data tables you defined yourself. Daily, weekly or monthly reports will be sent directly to the given email address.
xx
yyy
ANALYTICS
KPIs for steering. Resources where they pay.
Customisable dashboards bring the KPIs heads of sales steer on: weighted pipeline value, win rate by customer and lane, average tender cycle time, conversion by stage, capacity load by quarter. The numbers update with the pipeline; nobody re-builds the deck on Monday morning.
The same data drives resource allocation. Sales effort lands where the conversion curve actually pays, not on the lanes that feel busy.

SEE IT LIVE
Bring your pipeline. We’ll walk it through.
A 30-minute walkthrough on your actual pipeline, from stages, weighted revenue, capacity forecast to KPIs, with a Rail-Flow sales specialist.
Frequently asked questions.
FFive questions every head of sales and sales-ops lead asks before moving rail freight sales off spreadsheets. Anything missing? Just ask during your demo.
Have a question that's not covered here? Reach out and we'll get back to you within one business day.

Pipeline stages configure per organization, and per entity where group structure demands it. Role-based permissions across stages, customers, and opportunities are standard. Opportunities cluster into Key Accounts and Selling Centers the way rail sales segments customers. Stages add in the UI, not in a release cycle.
Weighted revenue = expected revenue × win probability, calculated per opportunity and rolled up by lane, customer, or pipeline stage. Win probability defaults by stage; override per opportunity. Contract duration spreads revenue across periods, multi-year contracts forecast across quarters automatically.
Yes. Configure dashboards per role (head of sales, key account manager, sales-ops) with the widgets you need . Standard KPIs come pre-built; additional metrics configure in the UI. See all relevant business data in the individual dashboard.
Yes. Each legal entity can have its own pipeline stages, sales templates, AGB / terms, and role-based permissions, while still sharing one customer database. Some customers run up to six legal entities on this architecture today. Forecasts and KPIs roll up across entities or filter to one, depending on who is looking.
PTM tender requests flow straight into ROM as opportunities. The Calculator prices them stretch by stretch and writes back to the opportunity record. Won opportunities transfer to the TMS for execution. Opportunities & Analytics is the steering layer; the rest of the platform supplies the data and consumes the outcome.
MORE FROM ROM & RAIL-FLOW
Explore related features.
Discover the other ROM capability that runs alongside Opportunities & Analytics, plus the two adjacent products that feed the pipeline and execute on the wins.
Calculator
Price every lane stretch by stretch with the cost components rail freight actually runs on:, locomotives, wagons, personnel, traction, tracks, services, foreign currency. The priced offer lands on the opportunity record.
Purchase & Tender Management (PTM)
315+ rail providers across 27 countries. Tender requests flow straight into ROM with routings pre-populated for the Calculator, no re-keying customer data.
Transport Management (TMS)
Won opportunities hand over directly to the TMS for execution. The capacity forecast that ran in ROM becomes the planboard that runs in TMS, same numbers, end to end.